
York University and University of Texas create map of past ice sheet movement
TORONTO, February 4, 2016 – Scientists have created the first map that shows how the Greenland Ice Sheet has flowed over time, revealing that ice in the interior is now moving more slowly toward the edges than it has, on average, over the past 9,000 years.
In comparing this paleo-velocity map to modern flow rates, researchers from York University and The University of Texas, as well as other institutions, found the ice sheet’s interior to be moving slower now than it was during most of the Holocene, a geological period that began at the end of the last glacial period roughly 11,700 years ago and runs to the present.
The findings, which researchers said don’t change the fact that the ice sheet is now rapidly losing mass and contributing to sea level rise, will be published in the Feb. 5, 2016 issue of the journal Science. Along Greenland’s periphery, many glaciers are now rapidly thinning. However, the vast interior of Greenland, as it moves more slowly, has been gradually thickening over millennia. This new study documents and describes why this is happening.
“We found three reasons for this gradual slowing and thickening of the ice sheet in the Greenland’s interior,” said William Colgan of York University’s Lassonde School of Engineering, second author of the study. The first two are an increase in snowfall over the last 9,000 years and a gradual stiffening of the ice sheet. “The ice that formed from snow that fell in Greenland during the last ice age is about three times softer than the ice being formed today.”
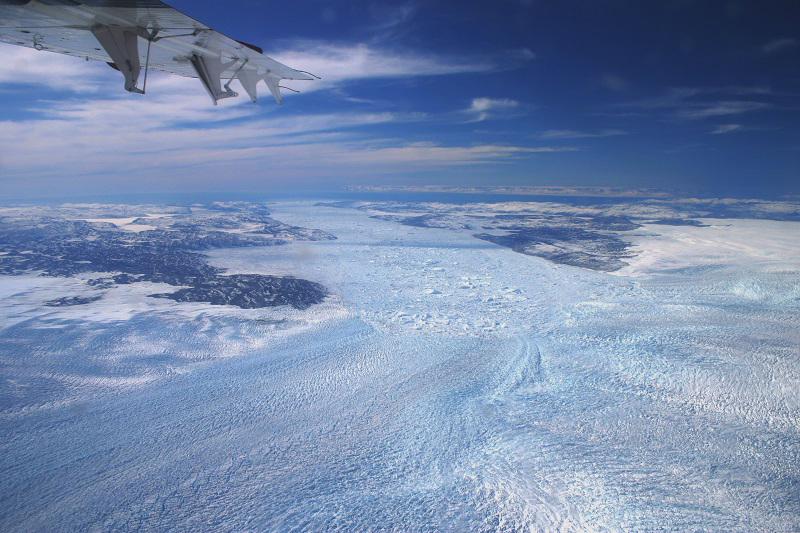
Oblique aerial photo looking west from the Greenland ice sheet interior towards Jakobshavn Isbrae, one of Greenland's largest outlet glaciers. Photo by William Colgan
This is causing the ice sheet to slowly become stiffer and as a consequence flow slower and get thicker over time. This is especially the case in southern Greenland, where higher snowfall rates have led to rapid replacement of ice from the last glacial period with more modern Holocene ice.
“But that didn’t explain what was happening elsewhere in Greenland, particularly the northwest, where there isn’t as much snowfall,” said lead author Joe MacGregor of The University of Texas at Austin’s Institute for Geophysics (UTIG), a research unit of the Jackson School of Geosciences.
“It is the third reason that seems to have had the largest impact in northwest Greenland,” said Colgan. An ‘ice bridge’ that connected Greenland to Ellesmere Island collapsed at the end of the last ice age, some 10,000 years ago.
The collapse led first to acceleration in the northwest, but ice flow there has since decreased to a slower pace. These changes affect how the Greenland Ice Sheet is understood today. Scientists often use GPS and altimeters aboard satellites to measure the elevation of the ice surface to estimate how much mass is being lost or gained across the ice sheet. But when correcting for other known effects on the surface elevation, any leftover thickening is often assumed to be due to increasing snowfall, but this study shows that may not be the case.
“The recent increases in snowfall do not necessarily explain present day interior thickening,” said Colgan. “So if you’re using a satellite altimeter to figure out how much mass Greenland is losing, you’re going to get the answer slightly wrong, unless you account for these very long-term signals that are evident in its interior.”
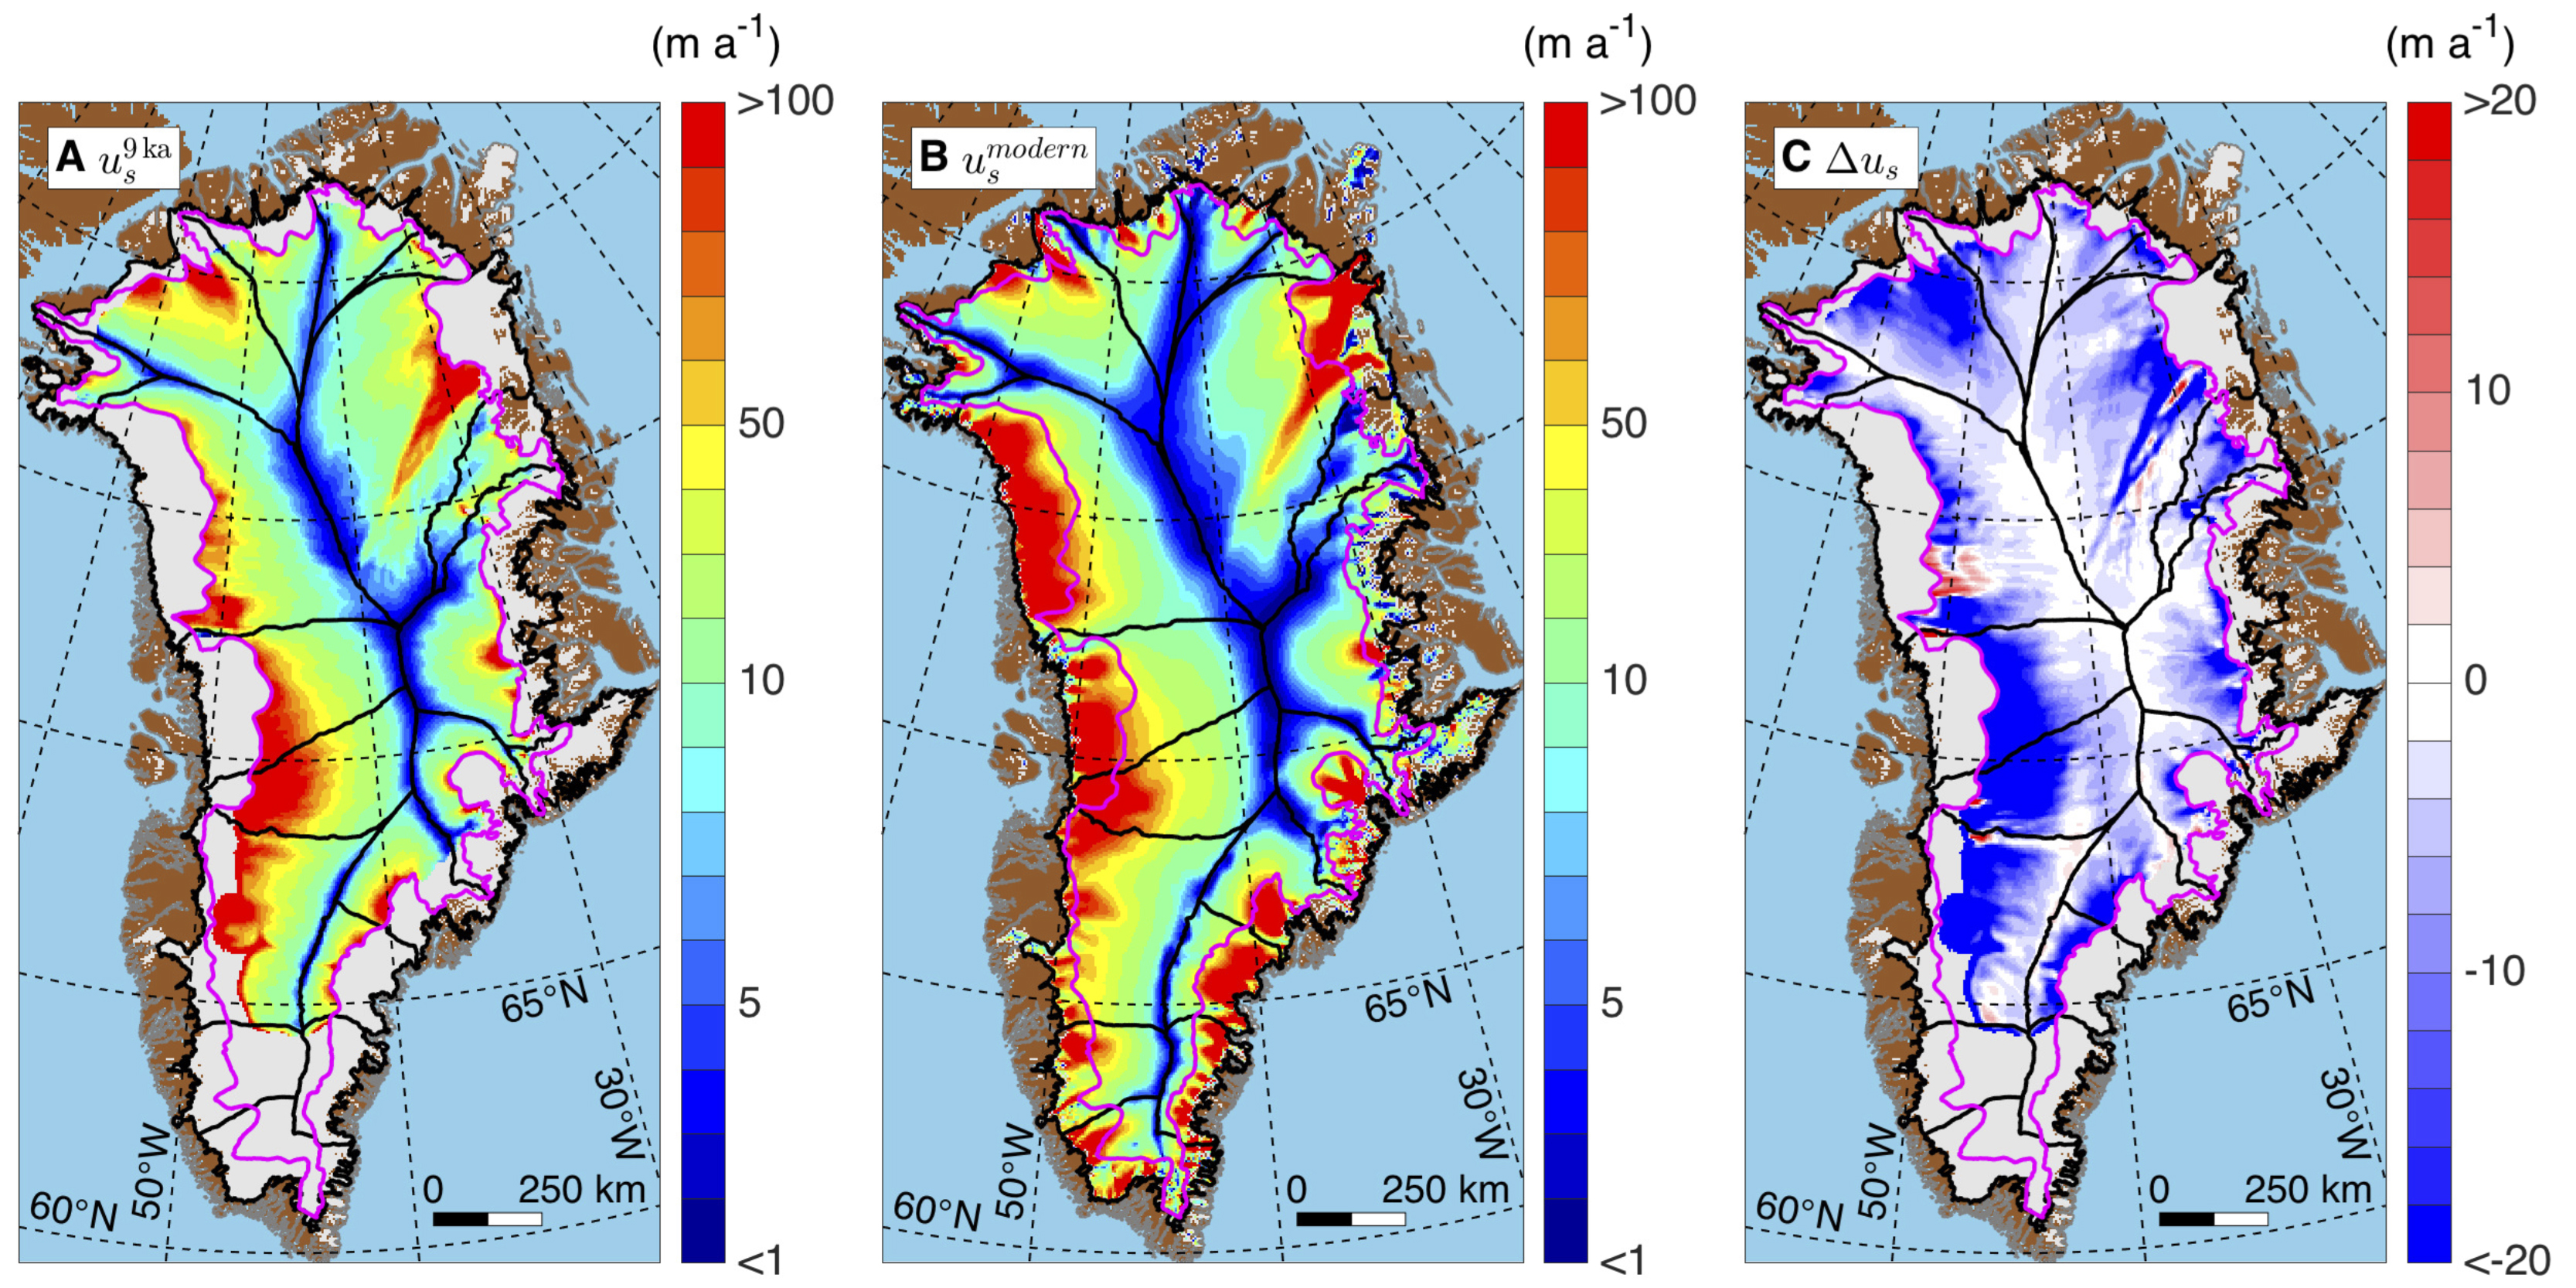
Greenland's average ice speed over the last nine thousand years (left), its current speed (center) and the difference between them (right). Blues (negative values) signify lower speeds today as compared to the nine-thousand-year average.
The study builds on earlier UTIG-led research that developed a database of the many layers within Greenland’s ice sheet. Using this database, the scientists determined the flow pattern for the past 9,000 years — in effect creating a “paleo-velocity” map.
“Scientists are very interested in understanding how ice sheets flow and how that flow may have been different in the past. Our paleo-velocity map for Greenland allows us to assess the flow of the ice sheet right now in the context of the last several thousand years,” said MacGregor.
The study was supported by the National Science Foundation’s Arctic Natural Sciences Program, the Center for Remote Sensing of Ice Sheets and NASA’s Operation IceBridge. Colgan is also a guest researcher at the Geological Survey of Denmark and Greenland, where a portion of this research was undertaken.
Note: A copy of the paper is available to media upon request.
York University is known for championing new ways of thinking that drive teaching and research excellence. Our 52,000 students receive the education they need to create big ideas that make an impact on the world. Meaningful and sometimes unexpected careers result from cross-discipline programming, innovative course design and diverse experiential learning opportunities. York students and graduates push limits, achieve goals and find solutions to the world’s most pressing social challenges, empowered by a strong community that opens minds. York U is an internationally recognized research university – our 11 faculties and 24 research centres have partnerships with 200+ leading universities worldwide.
-30-
Media Contacts:
Sandra McLean, York University Media Relations, 416-736-2100 ext. 22097 / sandramc@yorku.ca